Adjusting Histogram
Solution
Histogram is a graph showing the distribution of brightness. You can adjust the graph to adjust the image.
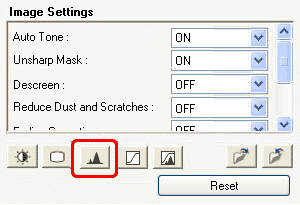
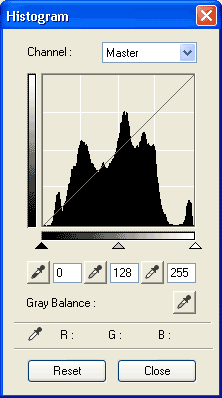
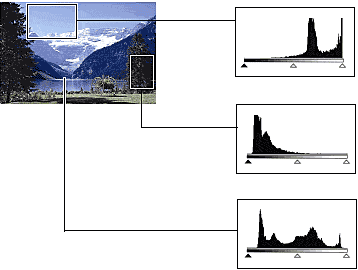
You can open a histogram of a specified area for each channel. The higher the [Histogram] peak, the more data is distributed to that level.
Select a [Channel], then move the black-point slider or the white-point slider to specify the level to be set as the shadow or highlight. All parts to the left of the black-point slider will turn black (level 0). All parts to the right of the white-point slider will turn white (level 255).
Original image

Images with more data distributed to the highlight side


Images with more data distributed to the shadow side


Move the black-point slider toward the highlight side, and white-point slider toward the shadow side.
Images with widely distributed data


Move the mid-point slider to specify the level to be set as the middle of the tonal range.
The mid-point slider is normally located between the black-point slider and the white-point slider.
Images with more data distributed to the highlight side


Images with more data distributed to the shadow side


When you select a [Channel] and click the black-point dropper (or white-point dropper), the mouse pointer on the preview image changes to a dropper. Click the point which you want to be the darkest (level 0) (or the brightest (level 255)) on the preview image.
Also, click the mid-point dropper and then click the point which you want to be the mid-point between the lightest and darkest colors to adjust the middle of the tonal range.

